
My posts about achievement levels within Minnesota’s public education system always generate a few interesting comments from individuals who want to downplay the declines — they either state the data is “bad” or that private school performance is worse so we shouldn’t be that concerned.
I have addressed the claims that student participation in statewide testing is low and that student opt-outs get averaged into proficiency scores as “zeros” — both false — a number of times and I cite where the Minnesota Department of Education also confirms this.
For the second claim, there is some data comparing nonpublic school student performance on the statewide Minnesota Comprehensive Assessments (MCAs) to their traditional public school peers, but it is limited because nonpublic schools are not required to administer the MCAs. Some nonpublic schools choose to administer the state assessment, while others choose to administer a nationally norm-referenced test instead. (Students attending nonpublic schools that are not accredited by a state-recognized accrediting agency must be assessed annually using a nationally norm-referenced standardized achievement test, in accordance with state law.)
Using the most recent data from spring 2025, there are seven schools — private religious schools and tribal schools — that we have reading and math MCA data for. Those results are reported here as “nonpublic” school data. Performance varies compared to their traditional public school counterparts.
For example, students at Al-Amal School, a private religious school in Fridley, performed significantly higher on the 2025 reading and math MCAs than their peers who attend the Fridley Public School District — 60.1 percent showed proficiency in math compared to the district at 29.8 percent. In reading, 72.2 percent were proficient compared to 33.5 percent within the district. Among third graders, 66.7 percent of the private school students read at grade level and 79.6 percent were proficient in math compared to 30.6 percent of the public school students reading at grade level and 38.5 percent proficient in math.
In St. Cloud, Prince of Peace Lutheran School had 54.4 percent of their students demonstrate math proficiency and 51.9 percent demonstrate reading proficiency. Math proficiency within the St. Cloud public school district came in at 24.4 percent and 33.5 percent for reading. Among third graders, 68.8 percent of Prince of Peace students were at grade level in math while 31.3 percent met the reading benchmarks. Proficiency among third graders in the district was at 34.9 percent for math and 31.4 percent for reading. Fourth-grade reading proficiency at Prince of Peace bounced back at 66.7 percent but went down among their district peers to 29.1 percent.
In the Milaca school district, 66.7 percent of Community Christian school students demonstrated proficiency in math and 70.4 percent were proficient in reading compared to district students at 42.5 percent proficiency for math and 46.3 percent for reading. Third graders at Community Christian were at 80.0 percent proficiency for math and 66.7 percent proficiency for reading compared to 53.6 percent of their peers in the district meeting grade-level math benchmarks and 48.0 percent for reading.
In the Carleton school district, the Fond du Lac Ojibwe School had 12.0 percent of students meet grade-level math standards and 17.1 percent of students reading at grade level compared to 28.6 percent in math and 32.5 percent in reading within the district.
In Cass County, 3.9 percent of students at Bug-O-Nay-Ge-Shig were proficient in math and 16.2 were reading at grade level compared to 13.8 percent of students meeting math standards and 18.5 percent of students meeting reading standards within Cass Lake-Bena public schools. However, proficiency among 7th graders at Bug-O-Nay-Ge-Shig was higher in both reading and math (36.4 percent and 18.2 percent) than it was among their 7th-grade peers within the district (11.3 percent and 4.9 percent). This was true in 5th grade as well.
At the Nay-Ah-Shing school in Mille Lacs County, 16.1 percent of students met grade-level reading benchmarks and 3.5 percent were proficient in math. Among students at Onamia Public School District, 22.7 percent were reading proficiently and 11.2 percent were doing math at grade level.
In the Long Prairie-Grey Eagle school district, 41.5 percent of students at St. Mary of Mt. Carmel demonstrated math proficiency and 41.5 percent demonstrated reading proficiency compared to 15.6 percent and 22.2 percent of students in the district.
Data from the National Assessment of Educational Progress (NAEP) show average scores nationwide in 4th-grade and 8th-grade reading and math among private school students were higher than the average reading and math scores for public school students in 2024 (the most recent available data). This held true in 2022, as well. (The data isn’t available by state.)
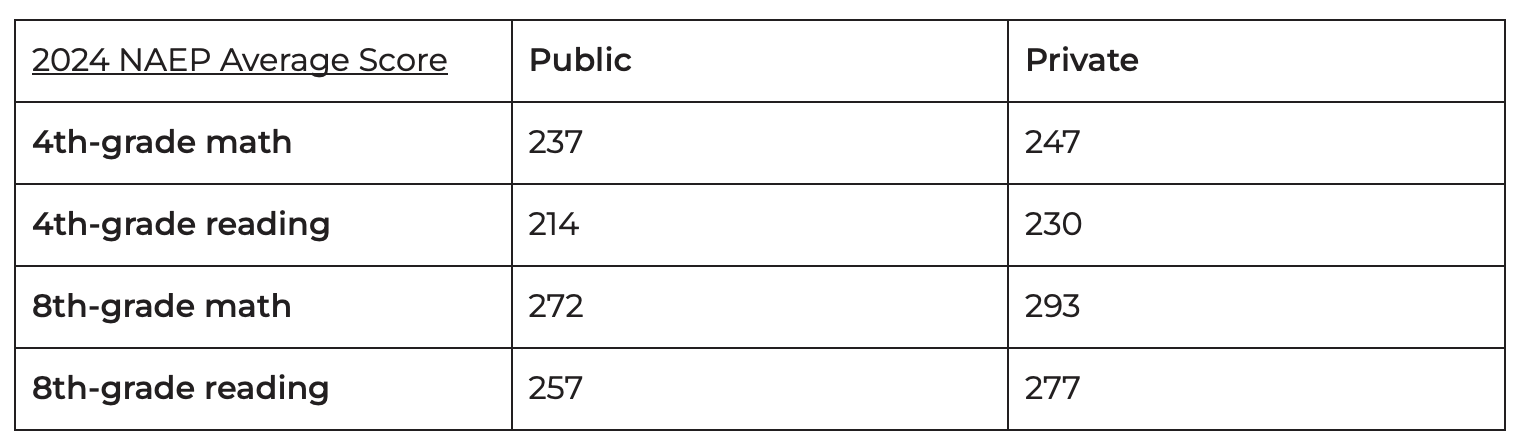
Source: National Assessment of Educational Progress
The role of assessments as an accountability metric and in measuring school quality will continue to be debated. In the meantime, we can work on bolstering what Kerry McDonald with the Foundation for Economic Education calls real accountability — that which lies with the consumers. “For true taxpayer accountability, we should expand opportunities for families to choose their preferred educational setting and let the market decide what’s good and what isn’t.” In Minnesota, an Education Savings Account program would open up such opportunities.


![[downloaded during free trial]](https://oakmn.org/wp-content/uploads/2025/11/iStock-1430368205-120x86.jpg)
